
Page 181 - CW E-Magazine (22-10-2024)
P. 181
Special Report Special Report
Recent developments in photovoltaics and the role East Hope 8% Hemlock OCI 4% the total cumulative PV installations
5%
amounted to 20%. In contrast, installa-
Asia Silicon 4% tions in China accounted for 43% (pre-
of the chemical industry TBEA Inner Mongolia Dongli 2%
(Xintel)
13% vious year 37%) and North America for
Others 4%
10%.
he global photovoltaic (PV) its dynamic 2022 market to install 11.9-GW, B.G. SAMPAT
cumulative capacity reached an bringing its cumulative capacity into Consultant Si-wafer based PV technology
Timpressive 1.6 terawatts (TW) the Top Ten worldwide. Email: bgsampat@gmail.com accounted for about 97% of the total
in 2023, up from 1.2-TW in 2022. This Tongwei 17% production in 2023. Mono-crystalline
growth was fuelled by the commissio- India had a slightly slower year with Ongoing research and innovation in technology became the dominant tech-
ning of approximately 446 gigawatts 16.6-GW, once again predominantly in the chemical industry is also contributing Wacker 13% nology in c-Si production while multi-
(GW) of new PV systems, with an centralised systems. to improving the effi ciency, durability, and crystalline technology is phasing out(2).
estimated 150-GW of modules in inven- cost-effectiveness of PV technologies.
tories worldwide. The CAGR of cumulative PV ins- Thin-fi lm technology PVs
tallations was about 26% between Key chemicals used in PVs Thin-fi lm technology PVs (TFTs)
According to a report – Snapshot 2013 to 2023. Several types of chemicals and GCL Poly 15% DAQO 15% are most commonly based on cadmium
of Global PV Markets 2024 – from the Table 1: TOP 10 Countries for Annual and Cumulative installed Capacity in 2023 Fig. 1: Polysilicon capacity by manufacturer, 2020 [Total: 513-ktpa]. telluride (CdTe), though copper indium
International Energy Agency Photo- Source: BloombergNEF 2021. gallium selenide (CIGS) is another
voltaic Power Systems Programme For Annual Installed Capacity For Cumulative Capacity Jinko Solar popular material, requiring a complex
(IEA PVPS), the market saw a signi- 1 China 235.5GW* 1 China 662.0 GW* 9% JA Solar 7% mixture of elements. Amorphous sili-
fi cant drop in module prices amidst an (2) European Union 55.8 GW (2) European Union 268.1 GW GCL 16% con (a-Si), a non-crystalline form of
oversupplied market, maintaining PV’s 2 United Stated 33.2 GW 2 United States 169.5 GW Jingyuntong 3% silicon, is also used in TFT solar cells.
competitiveness even as electricity 3 India 16.6 GW 3 India 95.3 GW Rietech 2%
prices declined post-2022 peaks. Solargiga 2% Cadmium is the main ingredient of
4 Germany 14.3 GW 4 Japan 91.4GW Trina 2% CdTe cells, and though it is categorized
With active development policies, 5 Brazil 11.9 GW 5 Germany 81.6 GW Huantai 2% as a naturally occurring earth metal,
Others 2%
China’s PV installations soared to a 6 Spain 7.7GW 6 Spain 37.6 GW only about half of the cadmium used
record 235-GW or over 60% of new 7 Japan 6.3GW 7 Brazil 35.5 GW makes it to the end product of the fi lm
global capacity, reaching 662-GW of Zhonghuan 21% used in the cells.
cumulative capacity. Remarkably, this 8 Poland 6.0 GW 8 Australia 34.6 GW
annual capacity represents over 15% of 9 Italy 5.3 GW 9 Italy 30.3 GW CdTe is the second-most common
the total global cumulative capacity and 10 Netherlands 4.2 GW 10 Korea 27.8 PV material after silicon, and CdTe
is nearly the equivalent of the second *Offi cial China reporting capacity, below IEA-PVPS preliminary assessment of 277-GW / 704-GW. Longi 34% cells can be made using low-cost manu-
largest cumulative capacity: Europe. Source: IEA PVPS. facturing processes. While this makes
This once again represented a more In addition to PV systems on buil- materials are used in the production of Fig. 2: Wafer capacity by manufacturer, 2020 [Total: 171-GW]. them a cost-effective alternative, their
than doubled annual installed capacity, dings (rooftop or building-integrated) and PV cells. Source: BloombergNEF 2021. effi ciencies still aren’t quite as high as
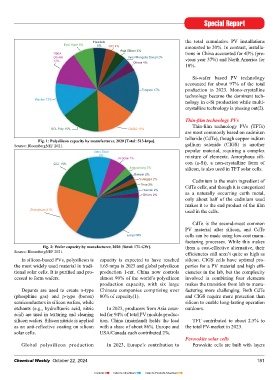
up from 105.5-GW in 2022 and 54.9-GW ground-mounted systems, more and more In silicon-based PVs, polysilicon is capacity is expected to have reached silicon. CIGS cells have optimal pro-
in 2021. systems are being installed on agricultural Silicon based the most widely used material in tradi- 1.65-mtpa in 2023 and global polysilicon perties for a PV material and high effi -
land (agrivoltaics) and bodies of water Polysilicon is a highly pure form of tional solar cells. It is purifi ed and pro- production 1-mt. China now controls ciencies in the lab, but the complexity
Europe demonstrated continued (fl oating PV). Furthermore, vehicle-integ- silicon (over 99.999%), often formed cessed to form wafers. almost 90% of the world’s polysilicon involved in combining four elements
strong growth installing 61-GW (of rated PV has entered the market. via the Siemens process, converting production capacity, with six large makes the transition from lab to manu-
which 55.8-GW was in the EU), led by 98-99% pure metallurgical grade sili- Dopants are used to create n-type Chinese companies comprising over facturing more challenging. Both CdTe
a resurgence in Germany (14.3-GW), Role of chemical industry con into silane gases, then vapor (phosphine gas) and p-type (boron) 80% of capacity(1). and CIGS require more protection than
and increased volumes in Poland (6.0- The chemical industry is integral depositing pure silicon crystals out of semiconductors in silicon wafers, while silicon to enable long-lasting operation
GW), Italy (5.3-GW) and the Nether- to the photovoltaic (PV) industry at the silane gas, at 10-20-nm per minute, etchants (e.g., hydrofl uoric acid, nitric In 2023, producers from Asia coun- outdoors.
lands (4.2-GW), whilst Spain dropped multiple levels: It provides key materi- at 600-1100°C, for 80-110 hours. acid) are used in texturing and cleaning ted for 94% of total PV module produc-
slightly (7.7-GW). als required for PV cells, modules, and Polysilicon is then further purifi ed silicon wafers. Silicon nitride is applied tion. China (mainland) holds the lead TFT contributed to about 2.5% to
systems; and chemicals are involved in and crystallized into mono-crystalline as an anti-refl ective coating on silicon with a share of about 86%. Europe and the total PV-market in 2023.
In the Americas, both major mar- the manufacturing processes, including polysilicon via the Czochralski method, solar cells. USA/Canada each contributed 2%.
kets grew – the USA, after a slow 2022, doping, etching, and surface passi- for use in PV solar and other semi- Perovskite solar cells
installed 33.2-GW, and Brazil sustained vation. conductor chips. Global polysilicon production In 2023, Europe’s contribution to Perovskite cells are built with layers
180 Chemical Weekly October 22, 2024 Chemical Weekly October 22, 2024 181
Contents Index to Advertisers Index to Products Advertised