
Page 173 - CW E-Magazine (3-9-2024)
P. 173
Special Report Special Report Special Report
permits. Using the APS as a benchmark, verse regions are not among the front- production, despite these minerals being
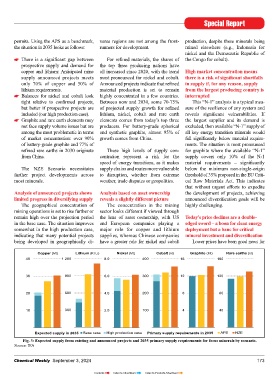
Lithium 250 Nickel 250 Cobalt 250 Copper 250 Graphite the situation in 2035 looks as follows: runners for development. mined elsewhere (e.g., Indonesia for
1 000
nickel and the Democratic Republic of
Index (Jan. 2021 = 100) 800 200 200 200 200 There is a signifi cant gap between For refi ned materials, the shares of the Congo for cobalt).
prospective supply and demand for the top three producing nations have
copper and lithium: Anticipated mine all increased since 2020, with the trend High market concentration means
supply announced projects meets most pronounced for nickel and cobalt. there is a risk of signifi cant shortfalls
150
600
150
150
150
material production is set to remain from the largest producing country is
lithium requirements.
400 100 100 100 100 only 70% of copper and 50% of Announced projects indicate that refi ned in supply if, for any reason, supply
Balances for nickel and cobalt look highly concentrated in a few countries. interrupted
200 50 50 50 50 tight relative to confi rmed projects, Between now and 2030, some 70-75% This “N-1” analysis is a typical mea-
but better if prospective projects are of projected supply growth for refi ned sure of the resilience of any system and
included (our high production case). lithium, nickel, cobalt and rare earth reveals signifi cant vulnerabilities. If
Jan Apr Jan Apr Jan Apr Jan Apr Jan Apr Graphite and rare earth elements may elements comes from today’s top three the largest supplier and its demand is
2021 2024 2021 2024 2021 2024 2021 2024 2021 2024
not face supply volume issues but are producers. For battery-grade spherical excluded, then available “N-1” supply of
Prices 2015-2020 average price among the most problematic in terms and synthetic graphite, almost 95% of all key energy transition minerals would
Fig. 2: Critical mineral prices, 2021-2024. of market concentration: over 90% growth comes from China. fall signifi cantly below material require-
Source: IEA of battery-grade graphite and 77% of ments. The situation is most pronounced
ing economies. In a scenario that limits – has by far the largest increase. Graphite The recent fall in prices has affected refi ned rare earths in 2030 originate These high levels of supply con- for graphite where the available “N-1”
global warming to 1.5°C (the Net Zero demand almost quadruples by 2040 in the investments in new mineral supply, but from China. centration represent a risk for the supply covers only 10% of the N-1
Emissions by 2050 [NZE] Scenario), the NZE Scenario, while demand for nickel, they are still growing speed of energy transitions, as it makes material requirements – signifi cantly
sales share of electric cars rises from 18% cobalt and rare earth elements doubles. Increases in 2023 were smaller than The NZE Scenario necessitates supply chains and routes more vulnerable below the minimum non-single-origin
today to 65% in 2030, pushing up demand those seen in 2022, but investment in criti- further project developments across to disruption, whether from extreme threshold of 35% proposed in the EU Criti-
for batteries by a factor of seven to 6 TWh Strong growth in demand produces cal mineral mining nonetheless grew by most minerals. weather, trade disputes or geopolitics. cal Raw Materials Act. This indicates
in 2030. Electric cars are the major source a major uptick in the overall value of 10%. Investment by lithium specialists that without urgent efforts to expedite
of demand for batteries, but battery storage critical minerals markets saw a sharp rise of 60%, despite weak Analysis of announced projects shows Analysis based on asset ownership the development of projects, achieving
for the power sector exhibits faster growth. The combined market value of key prices. Exploration spending also rose limited progress in diversifying supply reveals a slightly different picture announced diversifi cation goals will be
energy transition minerals – copper, lithium, by 15%, driven by Canada and Australia. The geographical concentration of The concentration in the mining highly challenging.
Today’s well-supplied market may not nickel, cobalt, graphite and rare earth Venture capital spending increased by mining operations is set to rise further or sector looks different if viewed through
be a good guide for the future, as demand elements – more than doubles to reach 30%, with signifi cant growth in battery remain high over the projection period the lens of asset ownership, with US Today’s price declines are a double-
for critical minerals continues to rise $770-bn by 2040 in the NZE Scenario. At recycling offsetting reduced investment in in the base case. The situation improves and European companies playing a edged sword – a boon for clean energy
Just as clean energy deployment around $325-bn, today’s aggregate market mining and refi ning startups. somewhat in the high production case, major role for copper and lithium deployment but a bane for critical
expands, so too does demand for critical value of key energy transition minerals indicating that many potential projects supplies, whereas Chinese companies mineral investment and diversifi cation
minerals. Mineral demand for clean aligns broadly with that of iron ore. By China’s spending on and acquisition being developed in geographically di- have a greater role for nickel and cobalt Lower prices have been good news for
energy technologies doubles between 2040, copper on its own attains that scale. of overseas mines has grown signifi cantly
today and 2030 in a scenario that re- in the past ten years reaching record levels Copper (Mt) Lithium (Kt Li) Nickel (Mt) Cobalt (kt) Graphite (Mt) Rare earths (kt)
fl ects today’s policy settings, the Stated The benefi ts of market expansion are of $10-bn in the fi rst half of 2023 with a 40 1 200 8.0 400 16 160
Policies Scenario (STEPS). It is even shared across different regions, particular focus on battery metals such as
higher in a scenario that meets all especially for mining lithium, nickel and cobalt.
national energy and climate goals in Latin America captures the largest 30 900 6.0 300 12 120
full, the Announced Pledges Scenario amount of market value for mined output Projections show a mixed picture for
(APS), and it almost triples by 2030 with around $120-bn by 2030. Indonesia future supply-demand balances 600 200 8 80
and quadruples by 2040 in the NZE sees the fastest growth, doubling its market Based on a detailed review of all 20 4.0
Scenario, reaching nearly 40-mt. value by 2030 due to its burgeoning nickel announced projects, we have constructed two
production. Africa witnesses a 65% in- supply scenarios. The base case includes 10 300 2.0 100 4 40
Lithium sees the most rapid growth in crease in market value by 2030. Nearly production from existing assets and those
demand, due to rising EV battery needs. 50% of the market value from refi ning under construction, along with projects
In the NZE Scenario, for example, it increa- is concentrated in China by 2030. China that have a high chance of moving ahead.
ses by a factor of nine to 2040. In terms also sees a rise in market value for mined The high production case adds in projects, Expected supply in 2035 Base case High production case Primary supply requirements in 2035 APS NZE
of production volume, copper – which materials with its growing copper and which are at a reasonably advanced stage Fig. 3: Expected supply from existing and announced projects and 2035 primary supply requirements for focus minerals by scenario.
connects a more electrifi ed energy system lithium production. of development, seeking fi nancing and/or Source: IEA
172 Chemical Weekly September 3, 2024 Chemical Weekly September 3, 2024 173
Contents Index to Advertisers Index to Products Advertised