
Page 171 - CW E-Magazine (3-9-2024)
P. 171
Special Report
Global Critical Minerals Outlook 2024
ritical minerals, which are An Executive Summary of the report share considerably in the demand for
essential for a range of clean follows: nickel, cobalt and graphite.
Cenergy technologies, have risen
up the policy agenda in recent years Fast-growing critical minerals markets The main reason for price declines
due to increasing demand, volatile price remain turbulent, with prices falling has been a strong increase in supply
movements, supply chain bottlenecks sharply in 2023 following two years and ample inventories of technologies
and geopolitical concerns. The dynamic of dramatic increases made with critical minerals
nature of the market necessitates greater Battery materials saw particularly From Africa to Indonesia and China,
transparency and reliable information to large declines with lithium spot prices the ramp-up of new supply outpaced
facilitate informed decision-making, as plummeting by 75% and cobalt, nickel, demand growth over the past two years.
underscored by the request from Group and graphite prices dropping by 30-45%. Together with an inventory overhang in
of Seven (G7) ministers for the Inter- The IEA Energy Transition Mineral Price the downstream sector (e.g. battery cells,
national Energy Agency (IEA) to pro- Index, which tracks a basket price of cathodes) and a correction of overly steep
duce medium and long-term outlooks copper, major battery metals and rare earth price rises in 2021-2022, this produced
for critical minerals. elements, tripled in the two years follow- downward pressure on prices.
ing January 2020, but relinquished most of
The Global Critical Minerals the increase by the end of 2023 – although Clean energy deployment continues
Outlook 2024 follows the IEA’s inau- copper prices remained at elevated levels. to advance in all our scenarios for
gural review of the market last year. the future, including a strong growth
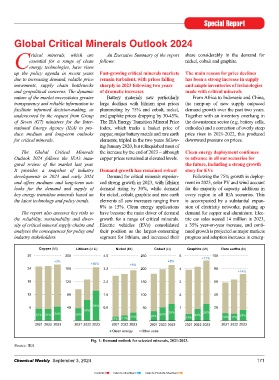
It provides a snapshot of industry Demand growth has remained robust story for EVs
developments in 2023 and early 2024 Demand for critical minerals experien- Following the 75% growth in deploy-
and offers medium- and long-term out- ced strong growth in 2023, with lithium ment in 2023, solar PV and wind account
looks for the demand and supply of demand rising by 30%, while demand for the majority of capacity additions in
key energy transition minerals based on for nickel, cobalt, graphite and rare earth every region in all IEA scenarios. This
the latest technology and policy trends. elements all saw increases ranging from is accompanied by a substantial expan-
8% to 15%. Clean energy applications sion of electricity networks, pushing up
The report also assesses key risks to have become the main driver of demand demand for copper and aluminium. Elec-
the reliability, sustainability and diver- growth for a range of critical minerals. tric car sales neared 14 million in 2023,
sity of critical mineral supply chains and Electric vehicles (EVs) consolidated a 35% year-on-year increase, and conti-
analyses the consequences for policy and their position as the largest-consuming nued growth is projected as major markets
industry stakeholders. segment for lithium, and increased their progress and adoption increases in emerg-
Copper (Mt) Lithium (kt Li) Nickel (Mt) Cobalt (kt) Graphite (Mt) Rare earths (kt)
30 200 4.0 250 5 +11% 100
+3% +8%
+30% +8%
24 160 3.2 200 4 80
+14%
18 120 2.4 150 3 60
12 80 1.6 100 2 40
6 40 56% 0.8 50 1 20
50%
22% 21% 24% 39% 15% 20% 26% 30% 22% 28% 23%
9% 11% 14% 19% 17%
2021 2022 2023 2021 2022 2023 2021 2022 2023 2021 2022 2023 2021 2022 2023 2021 2022 2023
Clean energy Other uses
Fig. 1: Demand outlook for selected minerals, 2021-2023.
Source: IEA
Chemical Weekly September 3, 2024 171
Contents Index to Advertisers Index to Products Advertised