
Page 185 - CW E-Magazine (19-12-2023)
P. 185
Special Report Special Report
EU27 chemical production up for fi rst time in six quarters,
but overall production level remains low
Summary Signs of life in the US and Asia-Pacifi c above September’s level in 2022. Recent
ince the rebound in 2021, the global The global industrial production grew data in China are showing ramping up
industry production has only shown by 0.5% in August, bringing output just electricity and oil demand, typically a sign
Sweak growth. Stress factors which above average production levels since of increasing industrial activity (Source:
continue to affect European business in- January 2022. The deterioration in Europe Oxford Economics Monthly Industry
clude external supply and demand deve- has been offset by recovery in Asia- Briefi ng/Global Industry-Oct. 2023).
lopments, energy costs, high interest rates Pacifi c. The global manufacturing PMI
and infl ation. With policy perspectives (Purchasing Managers’ Index) ticked EU27 chemicals confi dence improved
pointing in a direction of increasing EU slightly higher in September, up to 49.1, in Oct-2023
transformation costs, dependencies on which is 0.5 points higher than the July The latest economic survey shows
narrow technology choices with patchy low, but below most of H1 2023. an improvement in the confi dence in
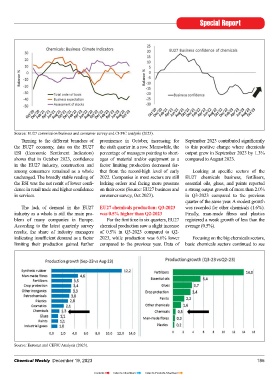
subsidies, the European chemical indus- the EU27 chemical industry. In October Source: EU27 commission business and consumer survey and CEFIC analysis (2023).
try is facing the third largest signifi cant US industrial output grew by 0.3% in 2023, chemicals production expectations Turning to the different branches of prominence in October, increasing for September 2023 contributed signifi cantly
decline in output among EU27 energy- September. The gradual recovery from the improved for the third month in a row. the EU27 economy, data on the EU27 the sixth quarter in a row. Meanwhile, the to this positive change where chemicals
intensive industries. drop in US output in Q4 2022 has, exactly It continues to progress and is now in the ESI (Economic Sentiment Indicators) percentage of managers pointing to short- output grew in September 2023 by 1.3%
one year later, led to output now surpass- positive territory for the second consecutive shows that in October 2023, confi dence ages of material and/or equipment as a compared to August 2023.
The latest economic survey clearly ing the post-pandemic peak of September month. The assessments of the stocks of in the EU27 industry, construction and factor limiting production decreased fur-
shows an improvement in the confi dence 2022. fi nished products decreased signifi cantly. among consumers remained as a whole ther from the record-high level of early Looking at specifi c sectors of the
in the EU27 chemical industry. In October Managers’ opinion on the current level unchanged. The broadly stable reading of 2022. Companies in most sectors are still EU27 chemicals business, fertilisers,
2023, chemicals production expectations The latest industrial growth fi gures in of overall order books improved sharply. the ESI was the net result of lower confi - lacking orders and facing more pressure essential oils, glues, and paints reported
improved for the third month in a row. For the Asia-Pacifi c region are encouraging. However, the economic and political dence in retail trade and higher confi dence on their costs (Source: EU27 business and a strong output growth of more than 2.0%
the fi rst time in six quarters, EU27 chemi- South Korea posted solid growth of 1.8% environment is still uncertain. It is there- in services. consumer survey, Oct 2023). in Q3-2023 compared to the previous
cal production saw a slight increase of in Sep-23 compared to Aug-23. South fore too early to confi rm whether this quarter of the same year. A modest growth
0.5% in the third quarter of 2023 versus Korea’s manufacturing PMI has almost positive trend will last over time. The The lack of demand in the EU27 EU27 chemicals production: Q3-2023 was recorded for other chemicals (1.6%).
the second quarter of the same year. The recovered to expansionary territory. India chemicals confi dence indicator is still at a industry as a whole is still the main pro- was 0.5% higher than Q2-2023 Finally, man-made fi bres and plastics
current production level (Q3-2023) is 10% continued its recent run of solid growth. low level and no sign of strong recovery blem of many companies in Europe. For the fi rst time in six quarters, EU27 registered a weak growth of less than the
below 2019, which was already a reces- Chinese production grew by 0.4% in is observed yet (Source: EU27 business According to the latest quarterly survey chemical production saw a slight increase average (0.5%).
sion year for the EU27 chemical industry. Sep-23 compared to Aug-23, and +4.5% and consumer survey, Oct 2023). results, the share of industry managers of 0.5% in Q3-2023 compared to Q2-
indicating insuffi cient demand as a factor 2023, while production was 6.6% lower Focusing on the big chemicals sectors,
Results (Sep-23) Results (Oct-23) limiting their production gained further compared to the previous year. Data of basic chemicals sectors continued to see
Global manufacturing activity Global manufacturing activity
Latest manufacturing PMI vs three month change (points) Latest manufacturing PMI vs three month change (points)
4 Contraction Expansion Indonesia 4 Contraction Expansion
3 Italy India
2 US PMI India 3 US ISM
S.Korea
1 US ISM China Improving 2 Taiwan S.Korea
China
0 Germany Eurozone Taiwan Global Deteriorating Germany Eurozone Global US PMI
3-month change -2 France UK Italy Japan The global 3-month change 1 0 UK Indonesia Deteriorating
-1
Improving
-3
-1
-4
manufacturing PMI
-5 ticked slightly higher -2 France Japan
-6 to 49.0 in August-23 -3
-7
-8 -4
38 39 40 41 42 43 44 45 46 47 48 49 50 51 52 53 54 55 56 57 58 59 38 39 40 41 42 43 44 45 46 47 48 49 50 51 52 53 54 55 56 57 58 59 60 61
Latest PMI data
Latest PMI data Source: S&P Global
Source: S&P Global
Source: Oxford Economics Monthly Industry Briefi ng (Oct 2023). Source: Eurostat and CEFIC Analysis (2023).
184 Chemical Weekly December 19, 2023 Chemical Weekly December 19, 2023 185
Contents Index to Advertisers Index to Products Advertised