
Page 187 - CW E-Magazine (19-12-2023)
P. 187
Special Report Special Report
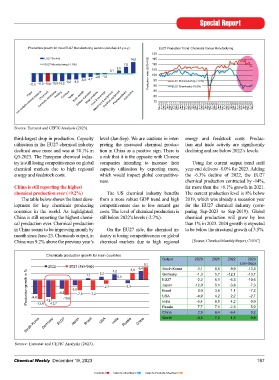
EU27 Chemicals production by sector (2021-2023) EU27 Chemicals production by sector Production growth for most EU27 Manufacturing sectors (Jan-Sep 23,y-o-y) EU27 Production Trend: Chemicals Versus Manufacturing
110 2021 2022 Jan-Sep ‘23 120
105 4,6 10,5 3,4 6,9 3,7 3,4 6,1 EU27 Sectors 3,1 7,8 14,0 115
100
110
EU27 Manufacturing (-1.0%)
Index (Jan-2021=100) 90 Production %Change (y/y) -9,8 -6,0 -8,0 -4,7 -7,4 2,5 -6,3 -10,6 -11,5 -11,0 -10,6 -10,3-10,2 -8,2 -8,0 -5,8 -4,7 -2,0 -1,5 0,1 Production Index (2015=100) 100 EU27 Manufacturing (-1.0%)
95
105
85
95
80
90
75
EU27 Chemicals (-10.6%)
85
70
Electrical equipment
Rubber & plastics
Food & beverage
Chemicals
Paper
65
Jan-21 Feb-21 Mar-21 April-21 May-21 June-21 July-21 Aug-21 Sep-21 Oct-21 Nov-21 Dec-21 Jan-22 Feb-22 Mar-22 April-22 May-22 June-22 July-22 Aug-22 Sep-22 Oct-22 Nov-22 Dec-22 Jan-23 Feb-23 Mar-23 April-23 May-23 June-23 July-23 Aug-23 Sep-23 -13,8 -15,6 -13,4 non-metallic mineral products Computer electronics Printing Furniture Textile Basic metals Metal products Machinery & equipment Phamaceutica
75
Basic Polymers Petrochemicals Specialities Consumer chemicals Petrochemicals Polymers Basic inorganics Specialities Consumers Chemicals* May-16 July-16 Sep-16 Nov-16 Jan-17 Mar-17 May-17 July-17 Sep-17 Nov-17 Jan-18 Mar-18 May-18 July-18 Sep-18 Nov-18 Jan-19 Mar-19 May-19 July-19 Sep-19 Nov-19 Jan-20 Mar-20 May-20 July-20 Sep-20 Nov-20 Jan-21 Mar-21 May-21 July-21 Sep-21 Nov-21 Jan-22 Mar
chemicals
inorganics
Source: Eurostat and CEFIC Analysis (2023). Source: Eurostat and CEFIC Analysis (2023).
a double-digit decline. 2023 output of tions), chemical prices and sales increased to July-2023. For the fi rst time since May
petrochemicals was 15.6% lower com- strongly since the beginning of 2021. This 2022, EU27 chemical sales saw a signifi - third-largest drop in production. Capacity level (Jan-Sep). We are cautious in inter- energy and feedstock costs. Produc-
pared to the same period last year. A trend was amplifi ed in the fi rst half of cant increase. It was the highest monthly utilisation in the EU27 chemical industry preting the increased chemical produc- tion and trade activity are signifi cantly
marked downturn was recorded for poly- 2022 due to the energy crisis and the war growth since 15 months. Both prices and declined once more and was at 74.1% in tion in China as a positive sign. There is declining and are below 2022’s levels.
mers (-13.4%). The drop in the production in Ukraine. Since then, prices and sales output reported a positive change of less Q3-2023. The European chemical indus- a risk that it is the opposite with Chinese
of basic inorganics (-8.0%) and specialty went down signifi cantly while production than 1% in August 2023 compared to try is still losing competitiveness on global companies intending to increase their Using the current output trend until
chemicals were comparatively moderate. is still fl at. July 2023. chemical markets due to high regional capacity utilisation by exporting more, year-end delivers -8.0% for 2023. Adding
With 3.4% growth, consumers chemicals energy and feedstock costs. which would impact global competitive- the -6.3% decline of 2022, the EU27
(soaps, detergents and cosmetics) are still At €445-bn, sales in the EU27 chemi- EU27 chemical industry reported the ness. chemical production contracted by -14%,
doing well compared to the other chemi- cal industry for the fi rst eight months of third-largest output decline in 2023 China is still reporting the highest far more than the +6.1% growth in 2021.
cals subsectors. All in all, chemicals pro- 2023 are below the levels recorded during (-10.6%) chemical production ever (+9.2%) The US chemical industry benefi ts The current production level is 8% below
duction declined by 10.6% for the fi rst the same period last year (-15.5%). 2023 output of EU27 manufacturing The table below shows the latest deve- from a more robust GDP trend and high 2019, which was already a recession year
three quarters of 2023 compared to the was slightly lower in comparison to the lopment for key chemicals producing competitiveness due to low natural gas for the EU27 chemical industry (com-
same period of 2022. The global economic and business same period of the previous year (-1.0%). countries in the world. As highlighted, costs. The level of chemical production is paring Sep-2023 to Sep-2019). Global
environment is not really helping the Sectors such as electrical equipment, China is still reporting the highest chemi- still below 2022’s levels (-2.7%). chemical production will grow by less
EU27 chemical sales reported the European chemicals companies better pharmaceuticals and automotive have cal production ever. Chemical production than 1% in 2023. 2024 growth is expected
highest monthly growth since resist to the crisis. EU27 chemicals sales contributed to limit the effects of the in China seems to be improving month by On the EU27 side, the chemical in- to be below the structural growth of 3.5%.
15 months (+1.8%) decline in 2023 comes with a persistently energy crisis on the EU27 manufacturing month since June-23. Chemicals output, in dustry is losing competitiveness on global
In 2022 chemical sales in Europe diffi cult revenue situation for companies. sector as a whole. China was 9.2% above the previous year’s chemical markets due to high regional [Source: Chemical Monthly Report, CEFIC]
reached an all-time high. Due to high However, since August 2023 (latest data
energy prices and increasing demand for available), data show a slight upturn and With 10.6% decline, the EU27 chemi- Chemicals production growth for main countries
chemicals (due to supply chain disrup- chemicals sales grew by 1.8% compared cal industry reported in 2023 (Jan-Sep) the Output 2020 2021 2022 2023
2022 2023 (Jan-Sep) 9,2 (Jan-Sep)
EU27 Chemicals Production, Prices and Sales EU27 Chemicals Growth (2023 vs 2022, Jan-Sep) 4,2 5,0 6,4 South Korea -3,1 8,6 -9,9 -13,8
(Jan-2021=100) 1,1 2,2 Germany -1,3 5,7 -12,1 -13,7
160 0,0
150 EU27 -2,2 6,1 -6,3 -10,6
140 -4,2 Production growth in % -6,3 -3,8 -7,3 -7,2 -2,7 -2,3 Japan -12,0 5,1 -3,8 -7,3
Brazil
0,0
1,1
3,6
-7,2
130
Index (Jan-2021=100) 120 Growth (in%, y-o-y) -10,6 -9,9 -13,8 -12,1 -10,6 USA -4,9 4,2 -2,3 -2,7
2,2
110
-5,4
India
8,0
0,0
4,2
-13,7
100
7,7
7,1
5,0
Russia
90
8,4
9,2
-6,4
2,9
China
80
-15,5
Jan-21 Feb-21 Mar-21 April-21 May-21 June-21 July-21 Aug-21 Sep-21 Oct-21 Nov-21 Dec-21 Jan-22 Feb-22 Mar-22 April-22 May-22 June-22 July-22 Aug-22 Sep-22 Oct-22 Nov-22 Dec-22 Jan-23 Feb-23 Mar-23 April-23 May-23 June-23 July-23 Aug-23 Sep-23 EU27 Sales* EU27 Producer Prices EU27 Production South Korea Germany EU27 Japan Brazil USA India Russia China World -0,5 7,2 1,5 0,9
EU27 Sales* EU27 Producer Prices EU27 Production
Source: Eurostat and CEFIC Analysis (2023). Source: Eurostat and CEFIC Analysis (2023).
186 Chemical Weekly December 19, 2023 Chemical Weekly December 19, 2023 187
Contents Index to Advertisers Index to Products Advertised