
Page 175 - CW E-Magazine (29-7-2025)
P. 175
Special Report Special Report
Ultrasonic testing equipment pro- the tape not in the scale. Also, if a C can provide both elemental and phase oxyhydroxides, aluminium oxides, copper
vides almost instantaneous results. or Au coating is used to provide elec- identifi cation of the sample from corrosion products and zirconium
Other vital information, such as trical conductivity, the low energy exactly same location. Such an approach oxides on a metal surface. However,
thickness, dimensional measure- x-rays will be suppressed, and any can be quite useful for multi-coloured not all metal oxides or sulphides have
ments, shape variations, etc., can data reduction can be skewed. scales and spatial distribution analyses. the necessary molecular vibrations or
also be obtained. excitations for detection.
Automated imaging systems can Another issue with EDS analyses is Bulk analysis of corrosion products
be used to produce detailed visual the requirement of a suffi cient accele- Although an EDS analysis can CONCLUSIONS
images of pipeline fl aws. rating voltage to excite the requisite provide local elemental analyses, it is Corrosion is one of the greatest
x-rays. In addition, there can be peak sometimes quite useful to obtain a bulk issues plaguing industries that rely
Limitations of ultrasonic testing overlap that can make data interpreta- quantitative analysis of the scale. Such heavily on piping distribution net-
While ultrasonic testing is eff ective tion diffi cult and force reliance on soft- information can be used to identify and works. If left unchecked, corrosion
at detecting the early onset of cracking ware for diff erentiating. quantify trace elements or the potential deteriorates the pipe’s wall thickness,
and other structural defects, it is essen- metal source for the deposit if it was no which can lead to loss of structural
tial for asset owners to understand X-ray Diff raction (XRD) longer adherent to the metal. Potential integrity, product loss and in extreme
the limitations of this technology to EDS analysis provides elemental instrumental techniques include x-ray cases, ruptures and explosion.
ensure best results are obtained. Some information such as Fe and O but can- fl uorescence (XRF) and inductively
common limitations include: not diff erentiate whether the corrosion coupled plasma (ICP-MS) atomic Early detection of corrosion in criti-
The pipeline must be accessible to products are hematite or magnetite. adsorption spectroscopy (AAS). Various cal pipeline distribution networks by
transmit the ultrasonic sound waves. Such identifi cation can be done with chromatographic instrumentation can using the above NDTs can mean the
This technique requires more skill XRD. With this technique the angles also be used to detect and quantify ion diff erence between minor repairs and
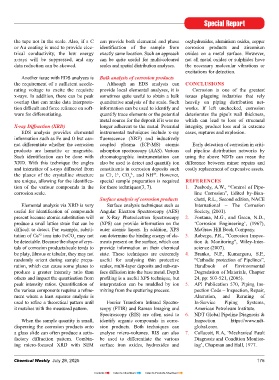
and training than some other testing Fig. 10: Shows elemental energy dispersive X-ray microanalyses from a mineral and intensities of x-rays diff racted from constituents in corrosion deposits such costly replacement of expensive assets.
particle ~2 μm diameter
methods. the planes of the crystalline structure as Cl , F , CO , and NH . However,
-
4+
2-
-
3
Materials that are rough, very small and to determine the corrective action assumed instrumental parameters are unique, allowing for the identifi ca- special sample preparation is required REFERENCES
or very thin can be diffi cult to ins- required to prevent future occurrences. (Figure-10). tion of the various compounds in the for these techniques(3, 7). 1. Peabody, A.W., “Control of Pipe-
pect or produce erroneous results. However, the analysis of any sample is corrosion scale. line Corrosion”, Edited by-Bian-
Testing equipment requires frequent only as good as what is being analysed Often the initial EDS analysis is Surface analysis of corrosion products chetti, R.L., Second edition, NACE
calibration in accordance with suit- because many oxide and sulphide done for the corrosion product on a Elemental analysis via XRD is very Surface analysis techniques such as International – The Corrosion
able reference standards. corrosion products are very susceptible metal or fracture surface. This can pro- useful for identifi cation of compounds Angular Electron Spectroscopy (AES) Society, (2001).
Cast iron pipes (or pipes construc- to degradation upon atmospheric vide information as to which metals present because atomic substitution will or X-Ray Photoelectron Spectroscopy 2. Fontana, M.G., and Green, N.D.,
ted from other rough materials) can exposure(7). (C, O, F, S or Cl) are present; but the produce a small lattice strain that can be (XPS) can provide information on the ‘Corrosion Engineering’, (1967),
be diffi cult to inspect due to low exact composition of the corrosion diffi cult to detect. For example, substi- outer atomic layers. In addition, XPS McGraw Hill Book Company.
+2
sound transmission or high signal to Energy Dispersive X-ray Spectroscopy product cannot be concluded. Although tution of Ca ions into FeCO may not can determine the binding energy of ele- 3. Roberge, P.R., “Corrosion Inspec-
3
noise ratio. (EDS) the x-rays that are analysed come from be detectable. Because the shape of crys- ments present on the surface, which can tion & Monitoring”, Wiley-Inter-
EDS, associated with a scan- the surface, they are emitted from an tals of corrosion products/scale tends to provide information on their chemical science (2007).
The proper method (straight or ning electron microscope (SEM), is excluded volume that can be several be platy, fi brous or tabular, they may not state. These techniques are extremely 4. Branko, N.P., Kumarguru, S.P.,
angle beam) needs to be employed the most common technique used for microns deep. This excluded volume randomly orient during sample prepa- useful for analysing thin protective “Cathodic protection of Pipelines”,
to ensure that all pipe defects are chemical identifi cation of corrosion can include the base metal or multiple ration, which can cause some planes to scales, multi-layer deposits and sub-sur- Handbook of Environmental
captured. products. EDS can detect elements C layers of the corrosion scale, particu- produce a greater intensity ratio than face diff usion into the base metal. Depth Degradation of Materials, Chapter
through U with a detectability limit of larly coming from piping scale. others and impact the quantisation from profi ling is a useful XPS technique, but 24, pp: 503-521, (2005).
Analysing corrosion products for about 0.1 weight percent. The scanned peak intensity ratios. Quantifi cation of interpretation can be muddled by ion 5. API Publication 570, Piping Ins-
failure analysis electron beam interacts with the Removal of the scale from the base the various components requires a refi ne- mixing from the sputtering process. pection Code – Inspection, Repair,
Many techniques such as scanning specimen’s surface, which produces metal or fracture surface can provide a ment where a least squares analysis is Alteration, and Rerating of
electron microscopy (SEM), energy secondary and back-scattered electrons more realistic analysis of the corrosion used to refi ne a theoretical pattern until Fourier Transform Infrared Spectro- In-Service Piping Systems,
dispersive x-ray spectroscopy (EDS) and x-rays. These x-rays are charac- product chemistry. The use of acetone- it matches with the measured pattern. scopy (FTIR) and Raman Imaging and American Petroleum Institute.
and x-ray diff raction (XRD) can be teristic for the element that emits them softened cellulose acetate replicating Spectroscopy (RIS) are often used to 6. NDT Global Pipeline Diagnosis &
employed to provide vital information and can be used to identify the elemen- tape is an excellent technique to re- When the sample quantity is small, identify organic compounds in corro- Inspection – https://www.ndt-
about corrosion products. Analysis and tal composition of corrosion products. move the scale from the base metal. If dispersing the corrosion products onto sion products. Both techniques can global.com.
identifi cation of corrosion products is a Unless standards are used, the analysis the tape procedure is used, an unused a glass slide can often produce a satis- analyse micro-volumes. RIS can also 7. Collacott, R.A, ‘Mechanical Fault
critical component of a failure analysis produces semi-quantitative analysis portion should be analysed to identify factory diff raction pattern. Combin- be used to diff erentiate the various Diagnosis and Condition Monitor-
in order to conclude the root cause based on the computer software and potential contaminant elements from ing micro-focused XRD with SEM surface iron oxides, hydroxides and ing’, Chapman and Hall, 1977.
174 Chemical Weekly July 29, 2025 Chemical Weekly July 29, 2025 175
Contents Index to Advertisers Index to Products Advertised