Page 15 - CW E-Magazine (Oct-Nov-2023)
P. 15

API Manufacturing


           heterogeneous,  and  electro-catalysis.   28%                                      27%         282
           While the choice of catalytic technique   25%                                            268
           employed for a transformation will de-                                             232
           pend on the target molecule, the avail-                                21%
           ability of different catalysts at industrial                                 183
           scale, the ability to develop appropriate         15%                  166               16%
           analytical methods and, of course, cost,              124   131   137
           there is no denying that biocatalysts are   95  109
           set for greater deployment commercially.  75           13%
                                                                       6%               10%
                                                                             5%                           5%
              While the decision to invest in new
           ‘Bulk  Drug  Parks’  is  welcome,  fiscal
           support to technology improvements
                                                                            FY18
                                                                                              FY21
                                                                                  FY19
                                                                                        FY20
                                                                                                   FY22
                                                           FY15
                                                     FY14
                                                                       FY17
                                                                 FY16
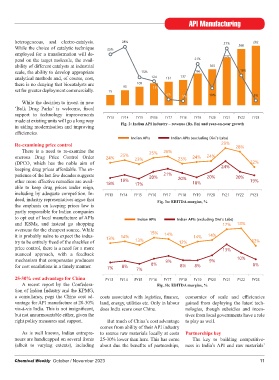
           made at existing units will go a long way   FY13  Fig. 2: Indian API industry – revenue (Rs. Bn) and year-on-year growth  FY23
           in aiding modernisation and improving
           efficiencies.                                 Indian APIs     Indian APIs (excluding Divi’s Labs)
                                                         Indian APIs     Indian APIs (excluding Divi’s Labs)
                                                                                            29%
           Re-examining price control                                                        29%  28%
                                                                                                   28%
              There  is  a  need  to  re-examine  the   25%     25%   26%              24%
                                                                      26%
           onerous  Drug  Price  Control  Order   24%  25%  23%  25%       23%   24%   24%              22%
                                                                                 24%
                                               24%
                                                                            23%
                                                           23%
           (DPCO,  which  has  the  noble  aim  of                                          24%         22%
           keeping drug prices affordable. The ex-                    21%                    24%
           perience of the last few decades suggests   19%      20%   21%  20%         20%        20%
                                                                                       20%
                                                                                                   20% 19%
                                                                20%
           other more effective remedies are avail-  18%  19%  17%          20%  18%                    19%
                                                                                 18%
                                               18%
           able to keep drug prices under reign,           17%
           including by adequate competition. In-  FY13  FY14  FY15  FY16  FY17  FY18  FY19  FY20  FY21  FY22  FY23
                                                                                  FY19
                                                     FY14
                                                                                       FY20
                                                                                             FY21
                                                          FY15
                                                                      FY17
                                                                            FY18
                                                                                                        FY23
                                                                                                   FY22
                                                                FY16
                                               FY13
           deed, industry representatives argue that   Fig. 2a: EBITDA margins, %    Fig. 3a: EBITDA margins, %
                                            Fig. 2a: EBITDA margins, %
           the emphasis on keeping prices low is
           partly responsible for Indian companies
           to opt out of local manufacture of APIs          Indian APIs    Indian APIs (excluding Divi’s Labs)
           and  KSMs,  and  instead  go  shopping           Indian APIs     Indian APIs (excluding Divi’s Labs)  18%
                                                                                             17%
           overseas for the cheapest source. While                                            17%   18%
           it is probably naïve to expect the indus-  13%  14%  15%   14%         14%   14%
                                                                 15%
           try to be entirely freed of the shackles of   13%  14%  13%  14%  12%  14%   14%              12%
           price control, there is a need for a more       13%              12%              13%          12%
           nuanced  approach,  with  a  feedback                                              13%
           mechanism that compensates producers                        9%               9%         10%
           for cost escalations in a timely manner.  7%  8%      8%    9%   8%    8%     9%         10%  8%
                                                                 8%
                                                7%    8%   7%                8%    8%                     8%
                                                           7%
           25-30% cost advantage for China     FY13  FY14  FY15  FY16  FY17  FY18  FY19  FY20  FY21  FY22  FY23
              A  recent  report  by  the  Confedera-  FY13  FY14  FY15  FY16 Fig. 3b: EBITDA margins, %   FY20  FY21  FY22  FY23
                                                                             FY18
                                                                      FY17
                                                                                  FY19
           tion of Indian Industry and the KPMG,   Fig. 2b: EBITDA margins, %
           a consultancy, pegs the China cost ad-  Fig. 2b: EBITDA margins, %   logistics, finance,  economies  of  scale  and  efficiencies
                                              costs associated with

           vantage for API manufacture at 20-30%  land, energy, utilities etc. Only in labour  gained  from  deploying  the  latest  tech-
           vis-à-vis India. This is not insignificant,  does India score over China.   nologies, though subsidies and incen-
           but not unsurmountable either, given the         Indian APIs     Indian APIs (excluding Divi’s Labs)
                                                                               tives from local governments have a role
                                                                            Indian APIs (excluding Divi’s Labs)
                                                            Indian APIs
           right policy measures and support.   But much of China’s cost advantage  to play as well.  20%
                                                     22%
                                                                21%
                                             comes from ability of their API industry         20%  19%
                                                     22%
                                                                 21%
                                               19%
                                                           19%
              As is well known, Indian entrepre-  to source raw materials locally at costs  Partnerships key  19%
                                                                      17%
                                               19%
                                                           19%
                                                                       17%
           neurs are handicapped on several fronts  25-30% lower than here. This has come   The   14%    13%
                                                                                  13% key  to  building  competitive-
                                                                            12%
           (albeit  to  varying  extents),  including  about  due  the  benefits  of  partnerships,  ness  in  India’s API  and  raw  materials’
                                                                                        14%
                                                     16%
                                                                                  13%
                                                                                             16%
                                                                16%
                                                                                                          13%
                                                                            12%
                                               13%   16%   13%   16%                          16%
                                               13%         13%        12%                          12%   11%
           Chemical Weekly  October / November 2023                    12%  9%          10%         12%     11
                                                                                  8%    10%               11%
                                                                             9%    8%
                                               FY13  FY14  FY15  FY16  FY17  FY18  FY19  FY20  FY21  FY22  FY23
                                               FY13  FY14  FY15  FY16  FY17  FY18  FY19  FY20  FY21  FY22  FY23
   10   11   12   13   14   15   16   17   18   19   20