
Page 187 - CW E-Magazine (15-7-2025)
P. 187
Special Report
Fig. 3: Share of chemical markets by country/region (% share)
Source: CEFIC, UN Comtrade Database, Ind-Ra
players with a lower export share stand remained under pressure on account of
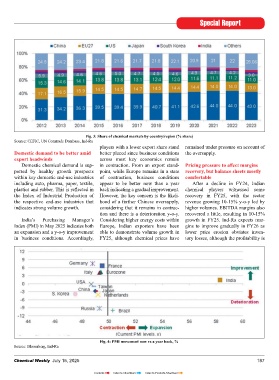
Domestic demand to be better amid better placed since business conditions the oversupply.
export headwinds across most key economies remain
Domestic chemical demand is sup- in contraction. From an export stand- Pricing pressure to aff ect margins
ported by healthy growth prospects point, while Europe remains in a state recovery, but balance sheets mostly
within key domestic end-use industries of contraction, business conditions comfortable
including auto, pharma, paper, textile, appear to be better now than a year After a decline in FY24, Indian
plastics and rubber. This is refl ected in back indicating a gradual improvement. chemical players witnessed some
the Index of Industrial Production of However, the key concern is the likeli- recovery in FY25, with the sector
the respective end-use industries that hood of a further Chinese oversupply, revenue growing 10-15% y-o-y led by
indicates strong volume growth. considering that it remains in contrac- higher volumes. EBITDA margins also
tion and there is a deterioration y-o-y. recovered a little, resulting in 10-15%
India’s Purchasing Manager’s Considering higher energy costs within growth in FY25. Ind-Ra expects mar-
Index (PMI) in May 2025 indicates both Europe, Indian exporters have been gins to improve gradually in FY26 as
an expansion and a y-o-y improvement able to demonstrate volume growth in lower price erosion obviates inven-
in business conditions. Accordingly, FY25, although chemical prices have tory losses, although the profi tability is
Fig. 4: PMI movement now vs a year back, %
Source: Bloomberg, Ind-Ra
Chemical Weekly July 15, 2025 187
Contents Index to Advertisers Index to Products Advertised