
Page 186 - CW E-Magazine (15-7-2025)
P. 186
Special Report
discretionary goods, thereby reducing $34.6-bn, of which the US accounts China’s dominance to continue, but
the overall US demand pie. In those for roughly 13%. India could gain market share
segments covered by the exemption India’s chemical market share in
list, the trade fundamentals would Import risk from China, increased 2023 stood at around 2.6% (2018:
persist. New US customer acquisition competition in export markets 2.7%; 2013: 2.0%), largely on par over
opportunities may arise due to lower China’s chemical exports to the US the last decade. In contrast, China has
Chinese volumes, although the long were in the range of $11-bn to $13-bn gained signifi cant market share which
approval process, especially for specialty across 2019-2024, of which the portion stood at around 43.1% in 2023 (2018:
chemicals, may make it more gradual. not part of the exemption list was $6-bn 40.7%; 2013: 34.2%) with Europe and
Also, there is the risk of supply chain to $7-bn, which would be the incremen- the US losing market share on account
disruptions, considering China’s domi- tal Chinese chemical supply excluding of higher energy costs, stringent regula-
nance within the chemical intermedi- US. A portion of this could fi nd its way tions and increasing global competitive
ate segment. The tariffs are on a 90-day into China’s domestic market. In such intensity.
pause announced in the fi rst half of April a scenario, government policy support
2025 with a fl at 10% rate applicable for would be a key monitorable. A key factor for China’s increased
most countries (except China which has global dominance is the higher capex
a rate of around 55%) in the interim. The India’s imports from China are spend, and increased capacities set up
progress on bilateral trade agreements is around $17-bn (35% of overall im- over the last decade. China accounted
a key monitorable. If the tariffs are pro- ports), which is largely in organic for around 45.2% of the overall global
longed, there would be more opportuni- chemicals. sectoral capex incurred over the last
ties with the ‘China+1’ strategy playing decade, compared to 2.1% in India.
out over the longer term within US. The chemical industry in India is Furthermore, China’s capex inten-
exposed to the risk of pricing pressure sity was highest at around 6.1% over
China’s share in US’ chemical and increased competitive intensity the past decade. While there have
imports declined to around 10% in 2023- in export markets excluding the US, been some instances of Indian chemi-
2024 from an average of 12.8% during with surplus volumes being diverted cal players winning on account of the
2018-2022. Over 2018-2024, India’s to other economies by China. The key ‘China+1’ strategy, there remains a
share in the US’s chemical imports geographies where domestic players fair share to be captured. In addition to
remained largely stable at 3.5% to 4%, could witness increased Chinese com- lowering capex spends, Indian players
indicating Indian exporters’ inability petition include agrochemicals (not have focused their research and
to gain the market share lost by China. exempt) in South America (Brazil) development on application-oriented
However, the US remains India’s key and organic chemicals (portion that is innovation and generic products rather
chemical export destination. India’s not exempt) in the UAE and Europe than basic research and new product
chemical exports in FY25 stood at (Netherlands). development.
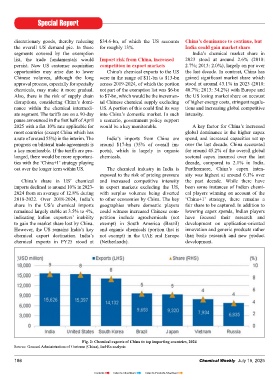
Fig. 2: Chemical exports of China to top importing countries, 2024
Source: General Administration of Customs (China), Ind-Ra analysis
186 Chemical Weekly July 15, 2025
Contents Index to Advertisers Index to Products Advertised