
Page 140 - CW E-Magazine (22-10-2024)
P. 140
Top Stories
MACRO TRENDS
IIP declines 0.1% on August; manufacturing grows
just 1%
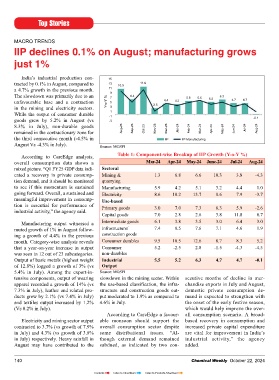
India’s industrial production con- 15
tracted by 0.1% in August, compared to 13 10.9 11.9
a 4.7% growth in the previous month. 11
The slowdown was primarily due to an 9 7 6.4 5.6 5.5 5.2 6.3
unfavourable base and a contraction Y-o-Y % 5 2.5 4.4 4.2 4.7 4.7
in the mining and electricity sectors. 3 PRODUCT RANGE
While the output of consumer durable -1 1
goods grew by 5.2% in August (vs -3 -0.1
8.3% in July), non-durable goods Aug-23 Sep-23 Nov-23 Dec-23 Jan-24 Jul-24 Aug-24
remained in the contractionary zone for Oct-23 Feb-24 Mar-24 Apr-24 May-24 Jun-24
the third consecutive month (-4.5% in IIP IIP-Manufacturing
August Vs -4.3% in July). Source: MOSPI
According to CareEdge analysis, Table 1: Component-wise Breakup of IIP Growth (Y-o-Y %)
overall consumption data shows a Mar-24 Apr-24 May-24 June-24 Jul-24 Aug-24
mixed picture. “Q1 FY25 GDP data indi- Sectoral
cated a recovery in private consump- Mining & 1.3 6.8 6.6 10.3 3.8 -4.3
tion demand, and it should be monitored quarrying
to see if this momentum is sustained Manufacturing 5.9 4.2 5.1 3.2 4.4 1.0
going forward. Overall, a sustained and Electricity 8.6 10.2 13.7 8.6 7.9 -3.7
meaningful improvement in consump- Use-based
tion is essential for performance of Primary goods 3.0 7.0 7.3 6.3 5.9 -2.6
industrial activity,” the agency said.
Capital goods 7.0 2.8 2.6 3.8 11.8 0.7
Manufacturing output witnessed a Intermediate goods 6.1 3.8 3.5 3.0 6.4 3.0
muted growth of 1% in August follow- Infrastructure/ 7.4 8.5 7.6 7.1 4.6 1.9
ing a growth of 4.4% in the previous construction goods
month. Category-wise analysis reveals Consumer durables 9.5 10.5 12.6 8.7 8.3 5.2
that a year-on-year increase in output Consumer 5.2 -2.5 2.8 -1.5 -4.3 -4.5
was seen in 12 out of 23 subcategories. non-durables
Output of basic metals (highest weight Industrial 5.5 5.2 6.3 4.7 4.7 -0.1
of 12.8%) logged a growth of 3% (vs Output
5.4% in July). Among the export-in- Source: MOSPI
tensive components, output of wearing slowdown in the mining sector. Within secutive months of decline in mer-
apparel recorded a growth of 14% (vs the use-based classifi cation, the infra- chandise exports in July and August,
7.3% in July), leather and related pro- structure and construction goods out- domestic private consumption de-
ducts grew by 2.1% (vs 7.4% in July) put moderated to 1.9% as compared to mand is expected to strengthen with
and textiles output increased by 1.2% 4.6% in July. the onset of the early festive season,
(Vs 0.2% in July). which would help improve the over-
According to CareEdge a favour- all consumption scenario. A broad-
Electricity and mining sector output able monsoon should support the based recovery in consumption and
contracted to 3.7% (vs growth of 7.9% overall consumption sector despite increased private capital expenditure
in July) and 4.3% (vs growth of 3.8% some distributional issues. “Al- are vital for improvement in India’s
in July) respectively. Heavy rainfall in though external demand remained industrial activity,” the agency
August may have contributed to the subdued, as indicated by two con- added.
140 Chemical Weekly October 22, 2024
Contents Index to Advertisers Index to Products Advertised