
Page 174 - CW E-Magazine (17-12-2024)
P. 174
Special Report
having a market value of $1-billion to Emerging markets delivered average are being felt across global markets.
$6-billion. Companies typically released fi ve-year TSR of 19%, outperforming Chinese capacity additions, coupled
data for the last fi nancial year between all other markets – which together with softer domestic demand, have not
early and mid-2024. To calculate indivi- delivered 10% – across most sectors. only reduced China’s imports of chemi-
dual companies’ TSR, we considered the (See Exhibit 2.) India led the pack cal products but have set the country
contribution of the various components with TSR of 24%. Its performance was up for exporting chemicals – especially
that make up this metric. (See “How We boosted by favorable demographics, bulk chemicals. China is already export-
Calculate and Report TSR.”). robust growth in chemicals demand ing polyethylene terephthalate (PET)
(starting from low per-capita chemical and polyvinyl chloride (PVC), among
Specialty Chemicals and Emerging consumption), supportive policies, and other products, and is likely to start
Markets Led the Field substantial infrastructure investment. exporting polypropylene (PP) soon.
Focused specialty chemicals, indus- These dynamics have caused a
trial gases, and agrochemicals and ferti- Despite facing a challenging envi- weakening in global prices for these
lizers all performed well at a sector level. ronment last year due to China’s soft- commodity products and have eroded
Base chemicals and plastics and multi- ening economy and weak property mar- the profi tability of non-Chinese players,
specialty chemicals performed poorly once ket, average fi ve-year TSR for Chinese especially companies with a sizeable
again. European multispecialty chemical chemical companies increased to 13% European asset footprint.
companies particularly struggled. At the between 2019 and 2023 from 8%
same time, the gap between the best- and between 2018 and 2022. The rise was This situation poses a particular
worst-performing subsectors widened, due to strong revenue growth, on the challenge for European chemical
with a spread of 21 percentage points for back of a substantial increase in pro- companies that compete with Chinese
the fi ve years to 2023 compared to 18 duction capacity, as well as improving players in these areas and are already
points between 2018 and 2022. valuation multiples. grappling with declining margins and
decisions about whether to close more
At a regional level, the global The effects of China’s enormous plants. (Chinese companies are
chemical industry continued to display capacity expansion (such as in siloxanes, actively targeting European markets
a wide variety of TSR performances. polyols, polyamides, and TiO ) in PET – where they are subject to EU
2
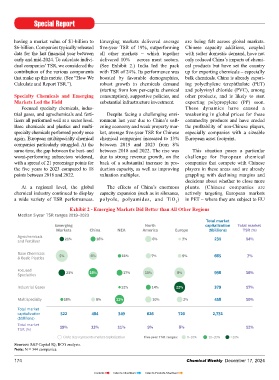
Exhibit 2 - Emerging Markets Did Better than All Other Regions
Median 5-year TSR ranges 2019–2023
Total market
Emerging North capitalization Total market
Markets China NEA America Europe ($billions) TSR (%)
Agrochemicals 231 14%
and Fertilizer 21% 16% 6% 7%
Base Chemicals 665 7%
& Basic Plastics 5% 6% 11% 7% 9%
Focused 23% 16% 17% 10% 8% 998 16%
Specialties
Industrial Gases 12% 14% 22% 379 17%
Multispecialty 18% 8% 11% 10% 2% 458 10%
Total market
capitalization 522 484 349 626 720 2,731
($billions)
Total market 19% 13% 11% 9% 8% 12%
TSR (%)
Circle size represents market capitalization Five-year TSR ranges: 0–10% 10–20% >20%
Sources: S&P Capital IQ; BCG analysis.
Note: N = 344 companies.
174 Chemical Weekly December 17, 2024
Contents Index to Advertisers Index to Products Advertised